How do I use the Desmos graphing calculator?
Exercises that allow a calculator will include the Desmos four-function, scientific, or graphing calculator built right into the exercise.
In this article, we'll explore how to use the Desmos graphing calculator. To follow along, open it at desmos.com/calculator.
Let's explore the calculator
The calculator is split into two parts:
- an expression list on the left (or bottom), where you type functions and expressions
- a graph on the right (or top), where the calculator plots those functions
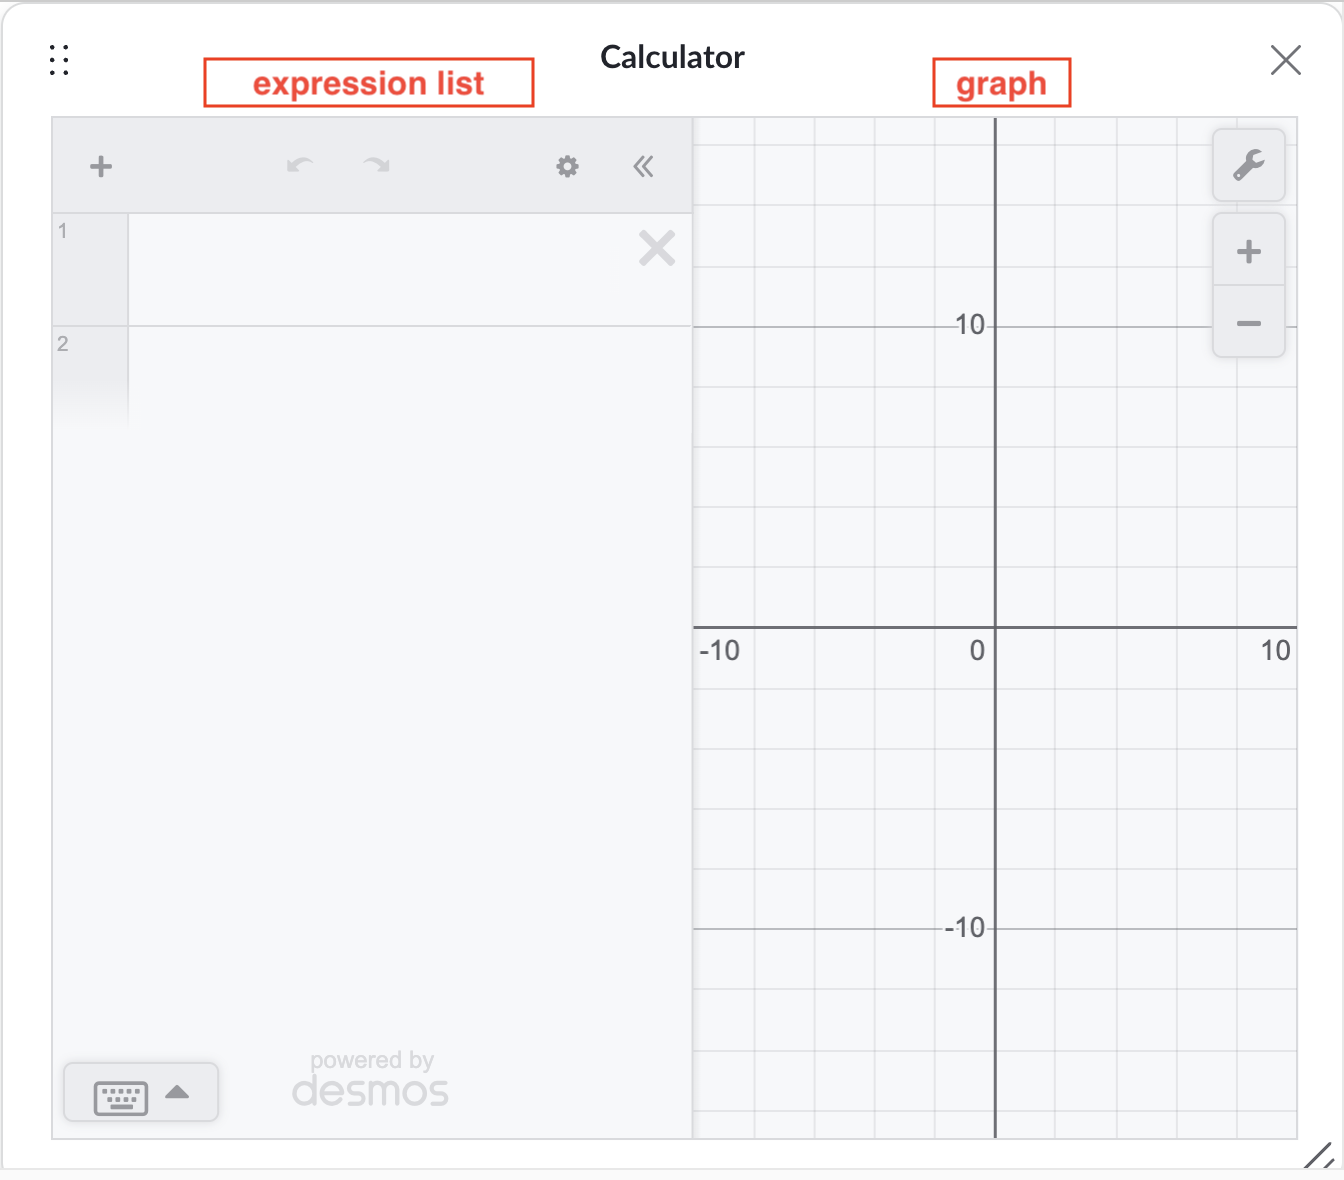
If you want more room to view your graph, click the two arrows at the top of the expression list to collapse it. You can also expand the entire calculator window by dragging the bottom right corner.
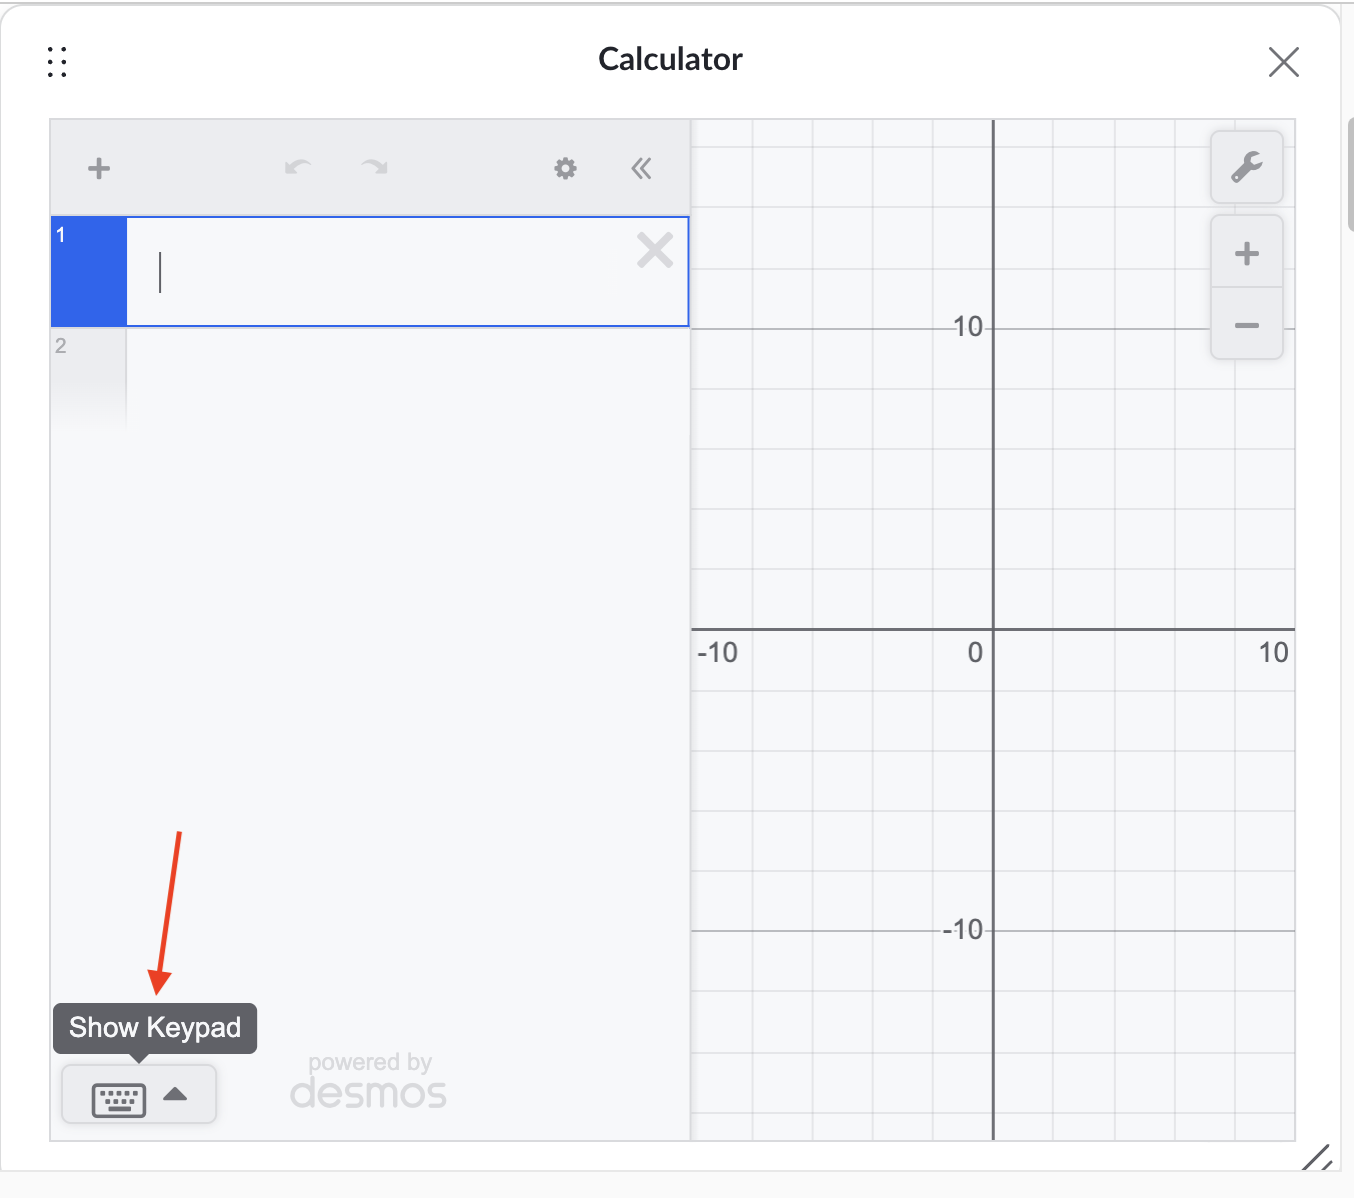
You can always type directly from your keyboard into the expression list. You can also access the calculator's symbols and functions by clicking the keypad icon in the bottom left of the calculator window.
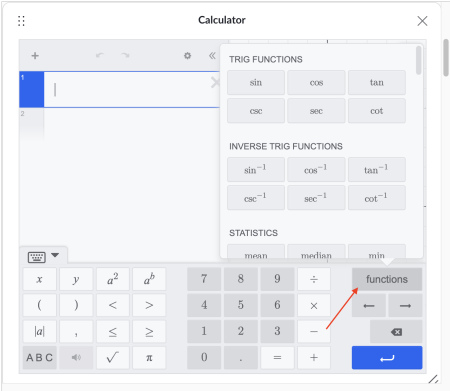
Notice the functions button in the calculator keyboard, and how it differs from the functions button in the Desmos scientific calculator. Here, the menu lists every built-in function and command, so you don't have to remember how to type each one from scratch. Simply click the desired function or command and input your values.
Working with the expression list
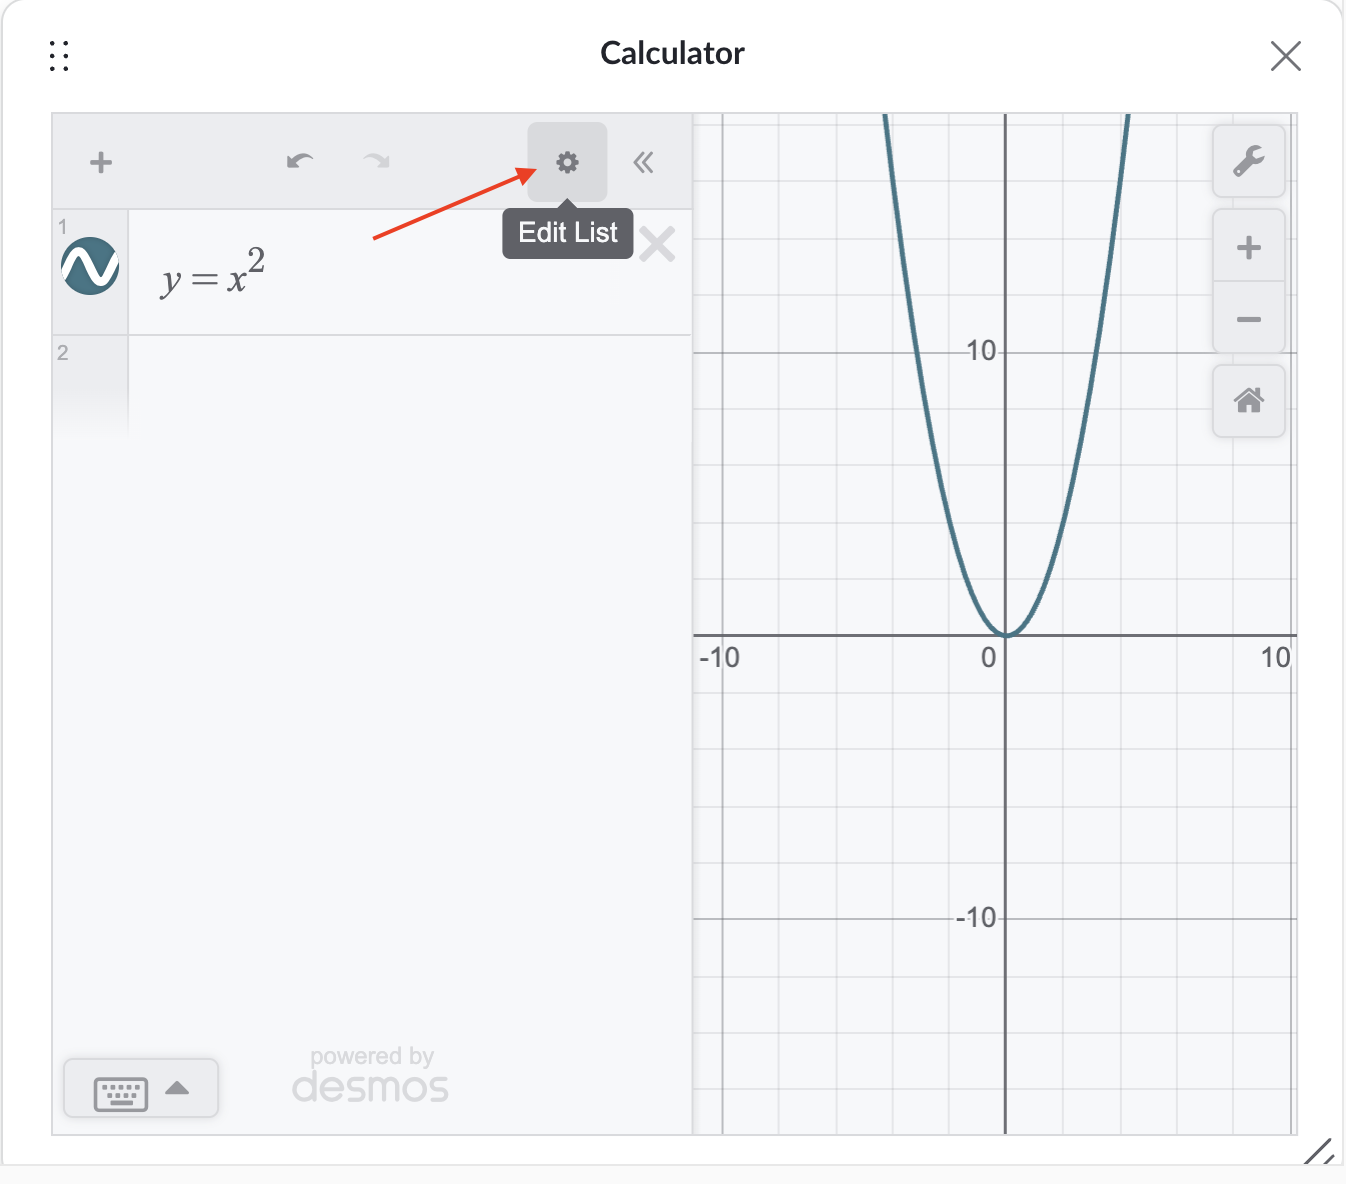
Once you've graphed a function, you can customize the graph using the Edit List button at the top right of the expression list.
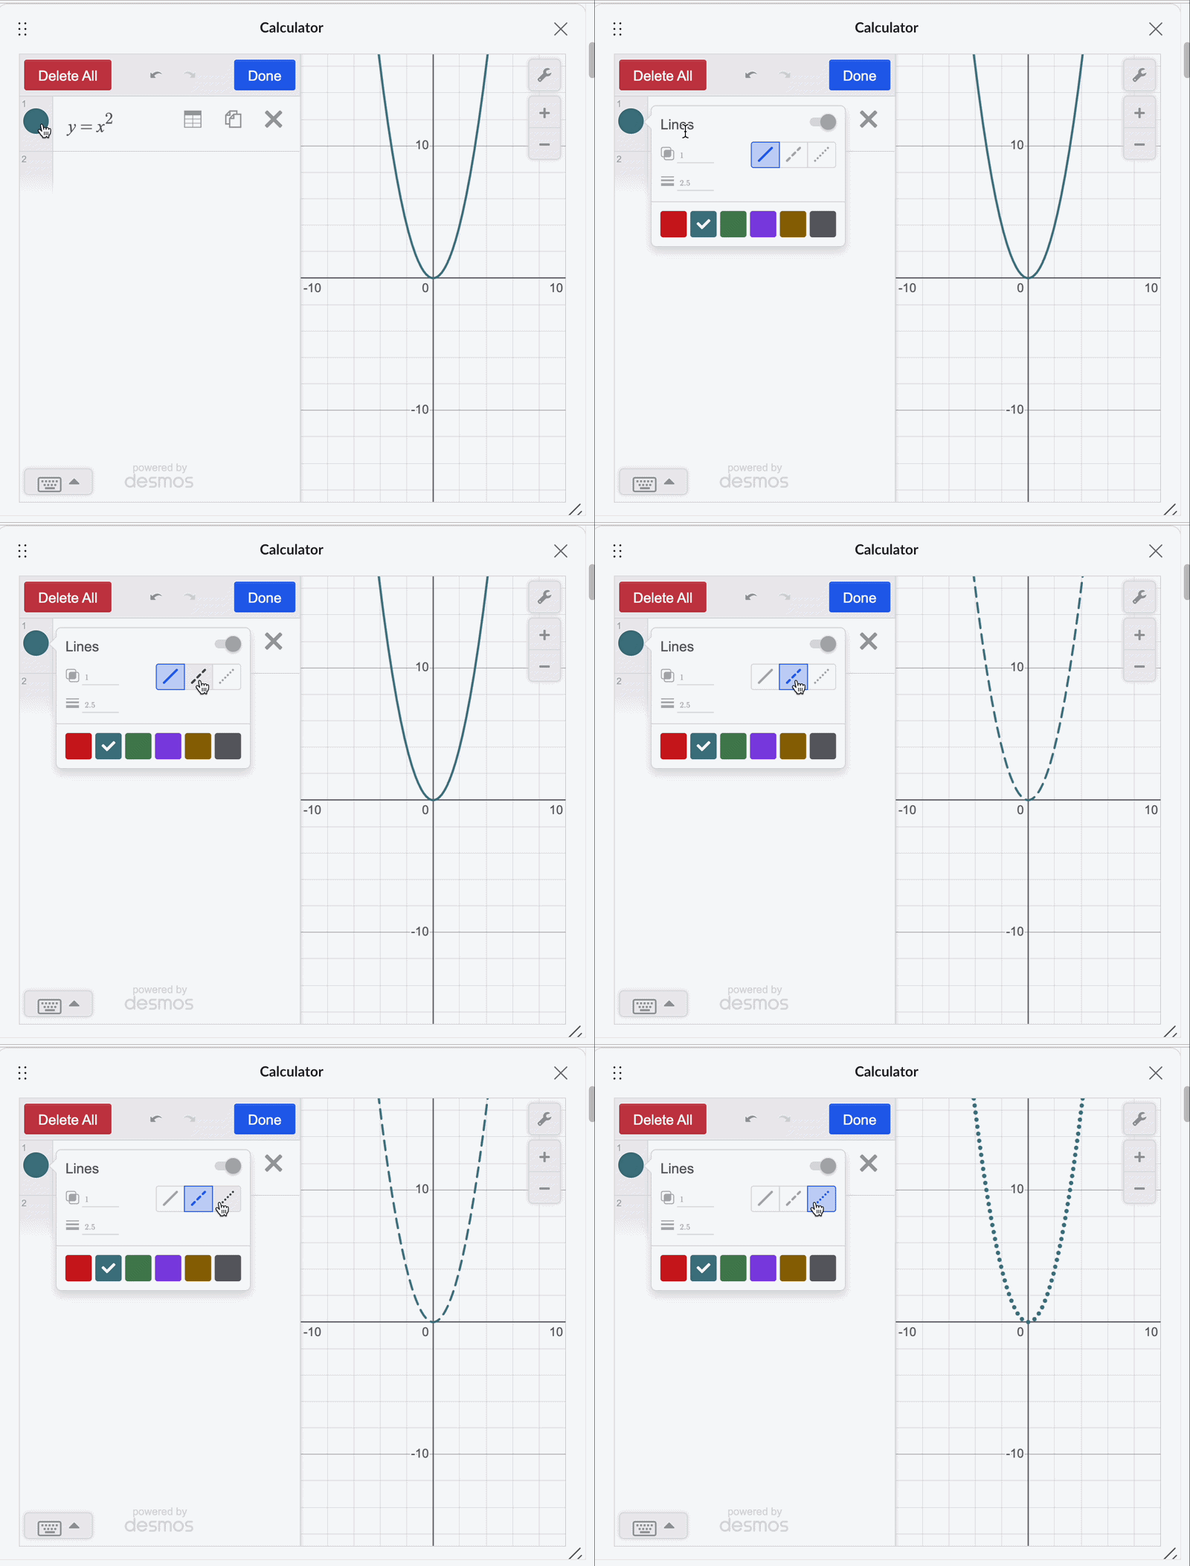
The leftmost circle
The leftmost circle allows you to change the graph's color, opacity, width, and line type (dashed or solid). The toggle on the right side of the circle pop-up box allows you to turn the function on and off. When the function is turned on, it appears on the graph. If you type multiple functions into different rows of the expression list, each one is plotted on the graph.
Create a table
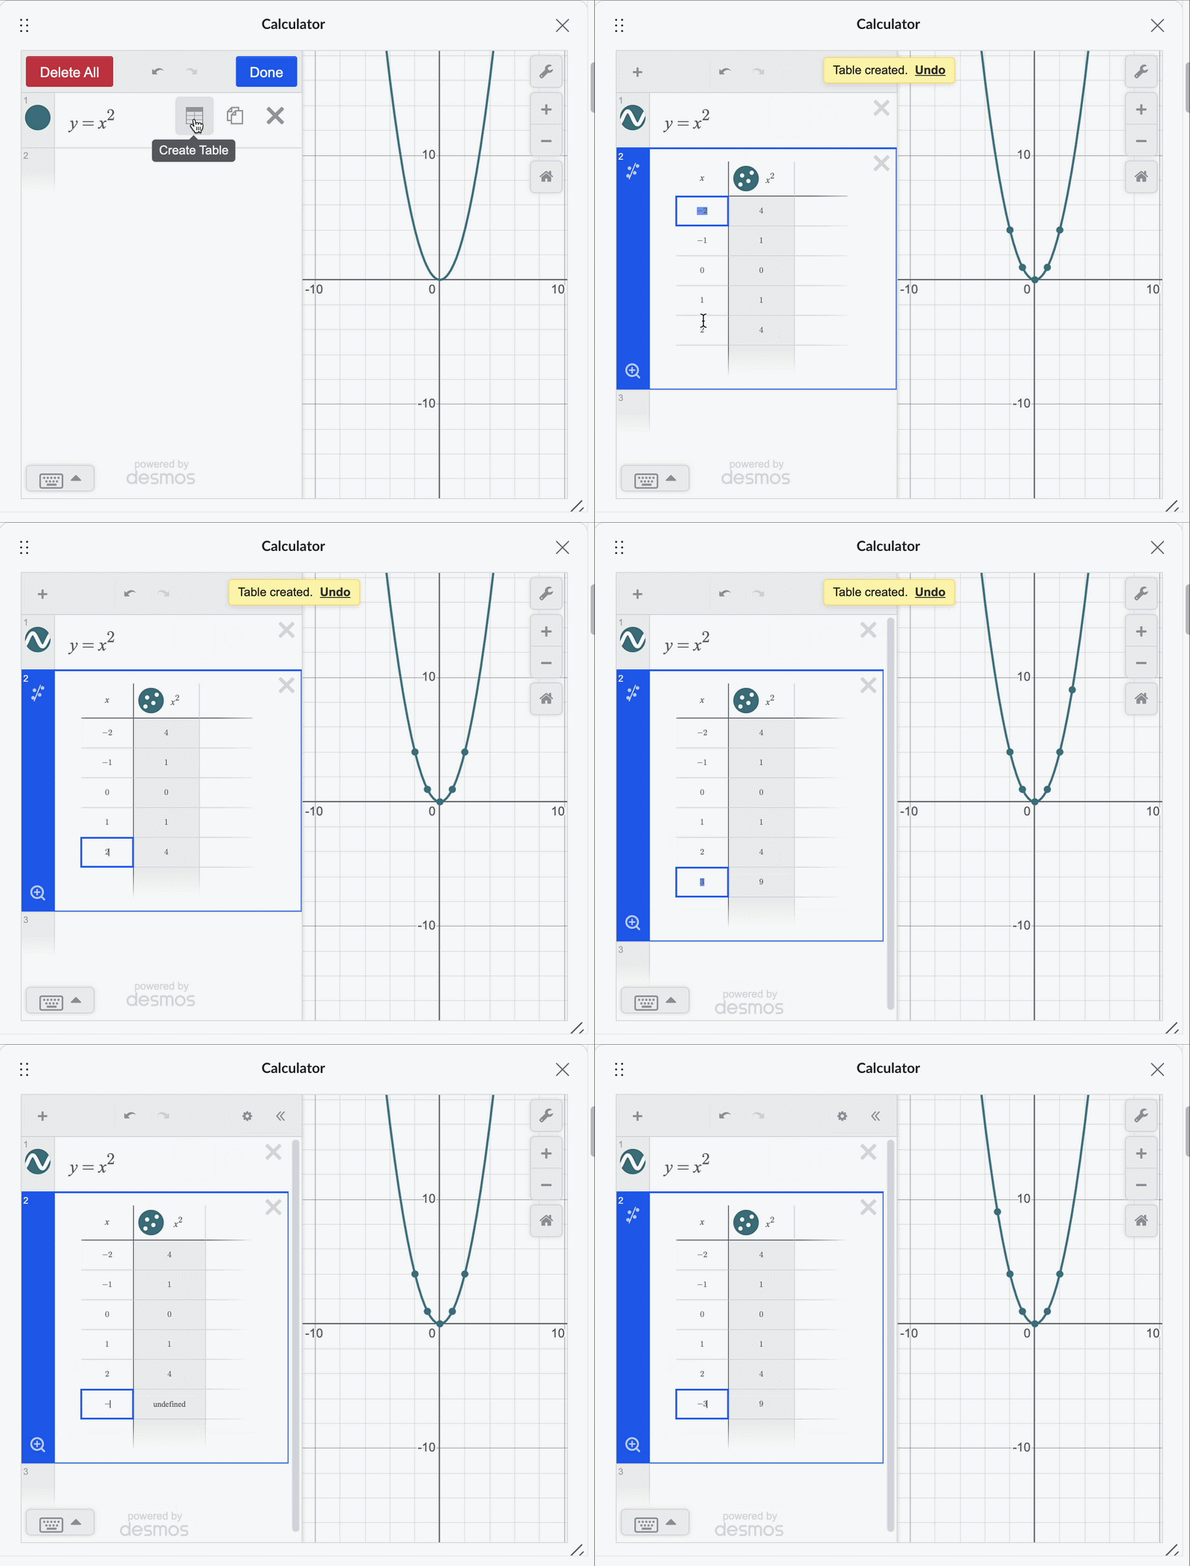
On the right of the function after clicking Edit List, a table button appears. This button will create a table of values for the function. You can edit the x-values in this table and add x-values to it, and the corresponding y-values will be calculated for you. When a new point is added, it will show up on the graph as long as the coordinate is in the designated window. The double page icon next to the table duplicates the function, while the × icon deletes it.
Calculations
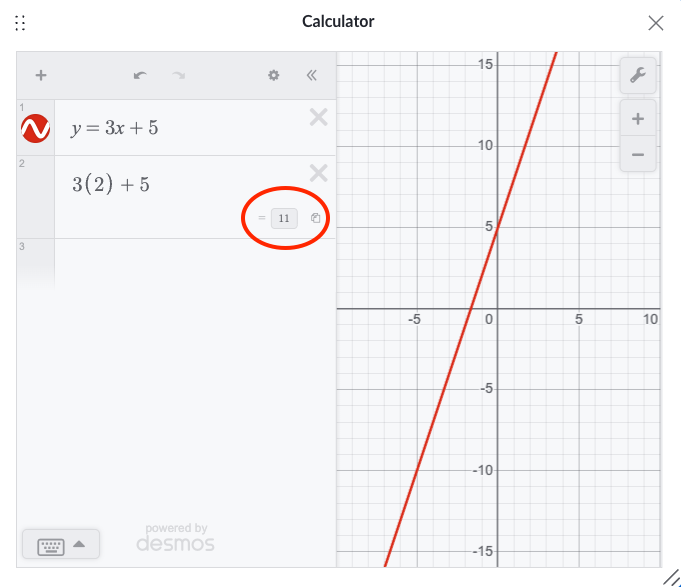
The graphing calculator's expression list has the same functionality as the scientific calculator. You can use the expression list for regular calculations in one or more lines. You will receive an answer, but it won't affect the graph.
Adding an item from scratch
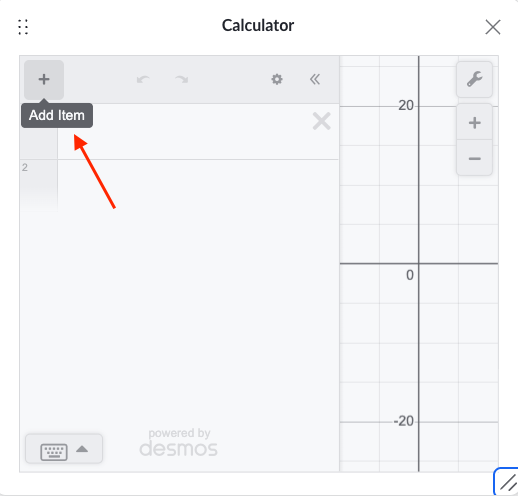
The + button at the top left of the expression list allows you to add a new expression, table or inference. Tables added this way begin completely empty, allowing you to add the x- and y-values manually.
Typing shortcuts
In addition to the calculator buttons, these are typing shortcuts for some common calculator commands.
| Command | How to type | Example |
|---|---|---|
| exponent | ^ |
2^3 → 23
|
| fraction | / |
1/2 → ½ |
| square root | sqrt |
sqrt(16) → √16 |
| cube root | cbrt |
cbrt(8) → ∛8 |
| nth root | nthroot |
nthroot 27, 3 → ∛27 |
| subscript | _ |
x_1 → x1
|
| logarithm | log |
log 100 → log(100) |
| natural log | ln |
ln(15) → ln(15) |
| custom log base | log_ |
log_2(8) → log28 |
| pi | pi |
π |
| infinity | infinity |
∞ |
| absolute value | abs |
abs(-5) → |−5| |
| previous answer | ans |
3+ans → adds the last computed value to 3 |
| trig function | csc( |
csc(x+2) → csc(x + 2) |
How do I type the rest of the trigonometric functions?
| Trig function | Calculator command |
|---|---|
| sine | sin( |
| cosine | cos( |
| tangent | tan( |
| cosecant | csc( |
| secant | sec( |
| cotangent | cot( |
Working with the graph settings
Clicking the wrench symbol at the upper right side of the grid opens the settings for the graph that allow you to:
- change the font size
- switch the grid between Cartesian and polar
- turn the grid, axis numbers, and arrows off
- adjust the x-axis and y-axis scales, steps, and labels
- switch between radian and degree mode
- turn on complex mode to work with imaginary and complex numbers
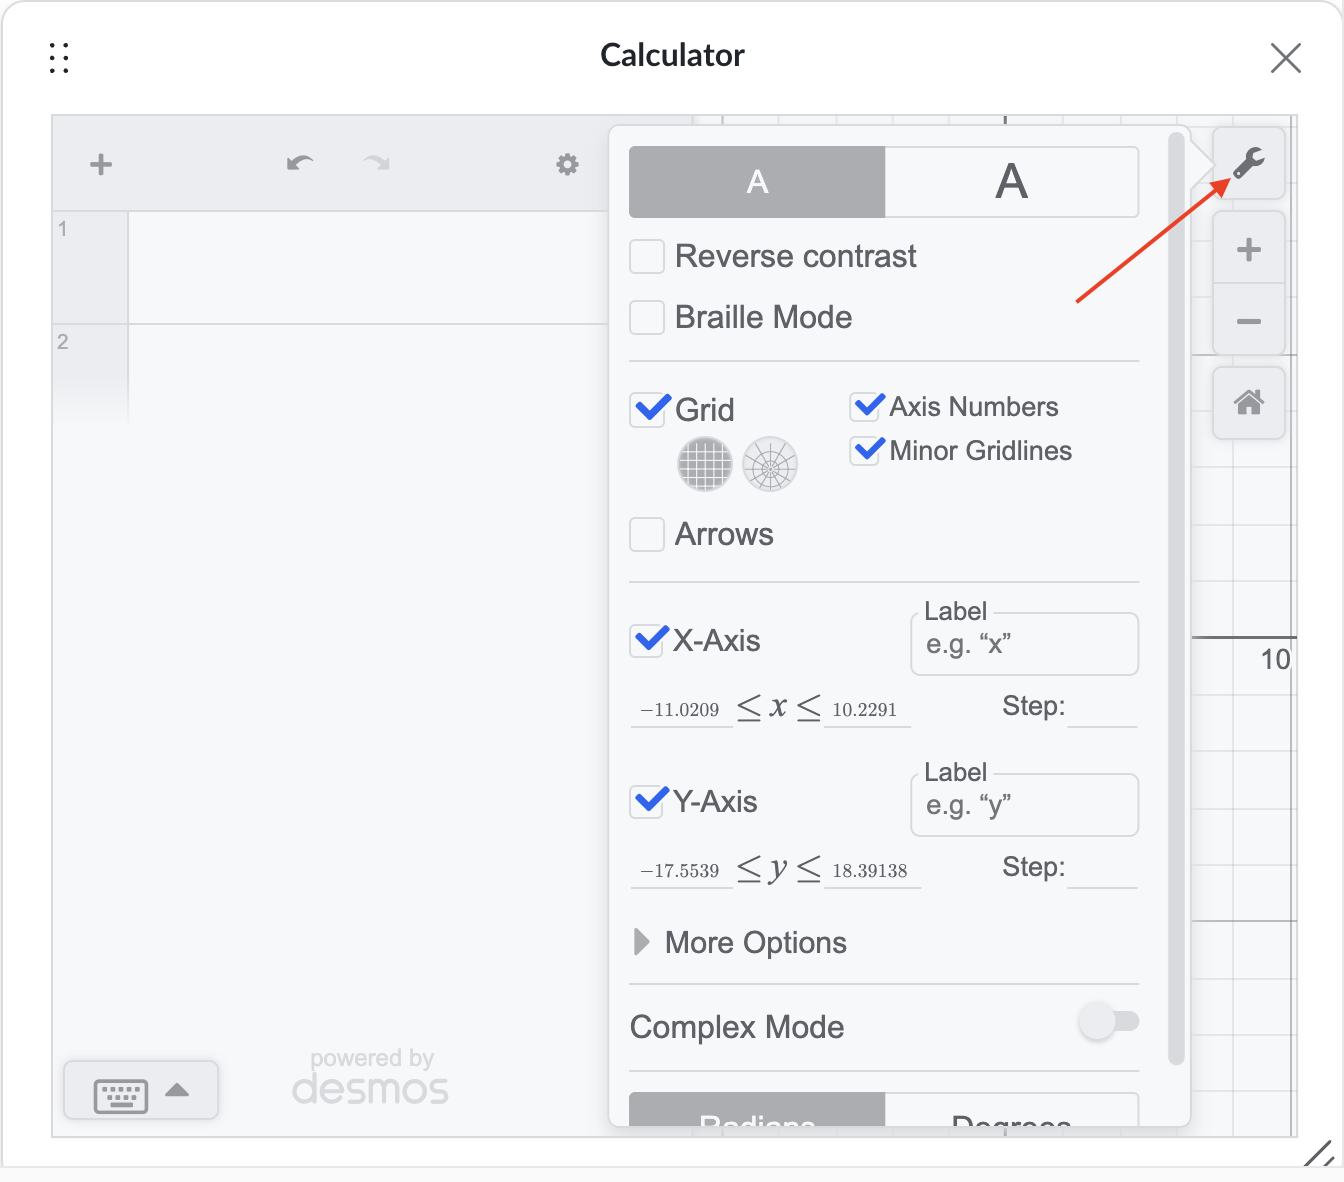
Using the plus and minus buttons underneath the wrench, you can zoom in and out of the graph. Then you can use your mouse to drag to the window you prefer. If you ever want to get back to the starting window, press the home button.
Summary
You're now ready to use the Desmos graphing calculator with confidence! To recap what we covered:
- The calculator is split into an expression list and a graph. You can always type directly from your keyboard, no matter which tab or menu is open.
- Once you graph a function, the Edit List button lets you customize each function's graph or build a table of values from a function.
- The wrench icon opens the overall graph's settings.
- A handful of typing shortcuts allow you to skip the on-screen buttons entirely and type expressions straight from your keyboard.
The best way to get comfortable is to keep experimenting! Graph a few functions of your own, build a table, switch modes, and see what changes. The more you play around with the calculator, the more natural it'll feel the next time a calculator-allowed exercise puts it right at your fingertips.