How can I find the console window on my browser?
When you encounter a problem on the Khan Academy website, your browser's console window might contain information about the problem that could help us identify and fix the issue. This article will show you how to open the console window in different browsers so that you can share the information you find there with us.
Start at the page where you are experiencing the problems. Follow the instructions below and take a screenshot of the open console window. If you can get a screenshot of the page in the background with the console window open, great! If not, just a screenshot of the open console window will work.
Attach the screenshot to your help request email. If there are too many errors to fit in the screenshot, please copy the text of the errors you see in the console window and paste the whole thing in the body of your email.
Chrome
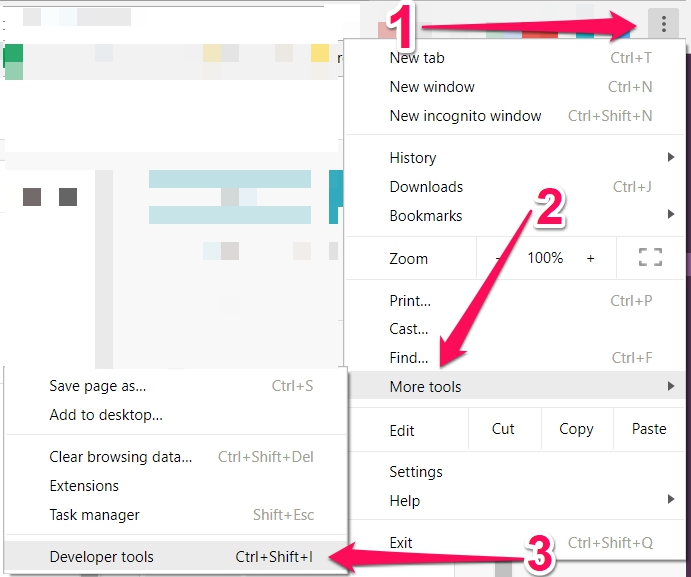
- Click the button with three vertical dots up in the upper right-hand corner
- Click More tools, and then Developer tools
- Make sure the tab in the half-window that appears is set to Console
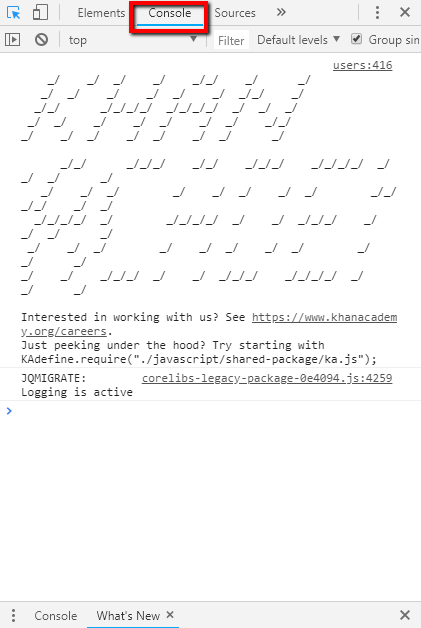
If there are any errors, they will be visible in red letters. There will also be a white x on a red dot and a number after it to tell how many errors have been registered.
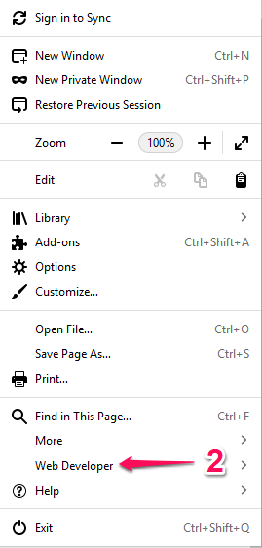
Firefox
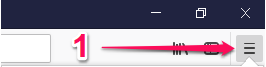
- Click the button with three horizontal bars in the upper right-hand corner
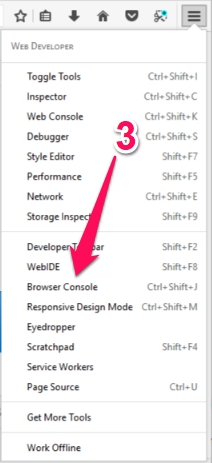
- Click Web Developer
- Click Browser Console